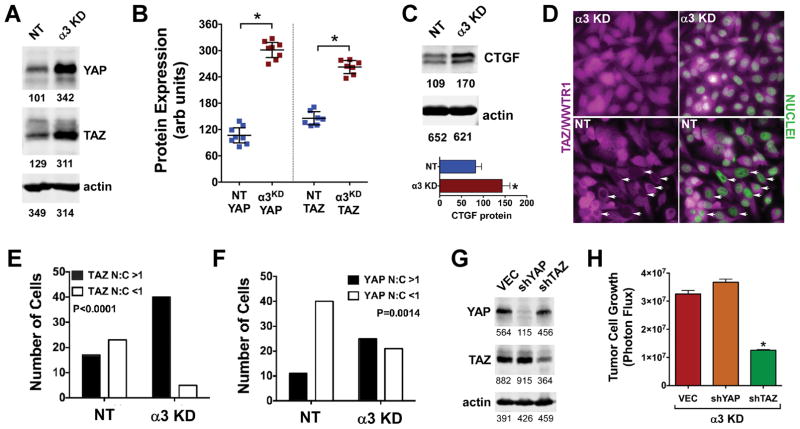
Figure 4. The α3-KD cells show increased YAP and TAZ expression and depend on TAZ for increased 3D growth.
(A) Immunoblot of YAP and TAZ in NT control and α3-KD cells growing under detached conditions. (B) Multiple independent experiments showed increased YAP and TAZ in α3-KD cells versus NT control cells. *P<0.0001, unpaired t test. (C) Lysates of NT control and α3-KD cells growing under detached conditions were immunoblotted for CTGF. The graph shows mean CTGF levels in 3 trials after normalization to actin. (D) Serum-starved α3-KD or NT control cells were treated with 5 μM LPA for 20 h then fixed and stained for TAZ (magenta), with nuclei counterstained with DAPI (green). Arrows indicate NT control cell nuclei with reduced or absent TAZ staining compared to adjacent cytoplasm. An identical experiment was performed for YAP (not shown). (E & F) The proportions of cells with a nuclear:cytoplasmic (N:C) ratio of TAZ or YAP greater than or less than 1.0 were determined using Image J. A larger number of 7agr;3-KD cells displayed a nuclear:cytoplasmic ratio of TAZ and YAP>1 (P<0.0001 or 0.0014 respectively, Fisher’s exact test, n ≥ 40 cells). (G) Stable knockdown of YAP and TAZ in α3-KD cells. (H) Knockdown of TAZ but not YAP inhibited growth of the α3-KD cells on 3D collagen (P<0.0001, ANOVA with Tukey’s post-test; bars show mean ± SEM, n=6). Numbers below immunoblots show intensity units measured with a LiCOR blot imager.

