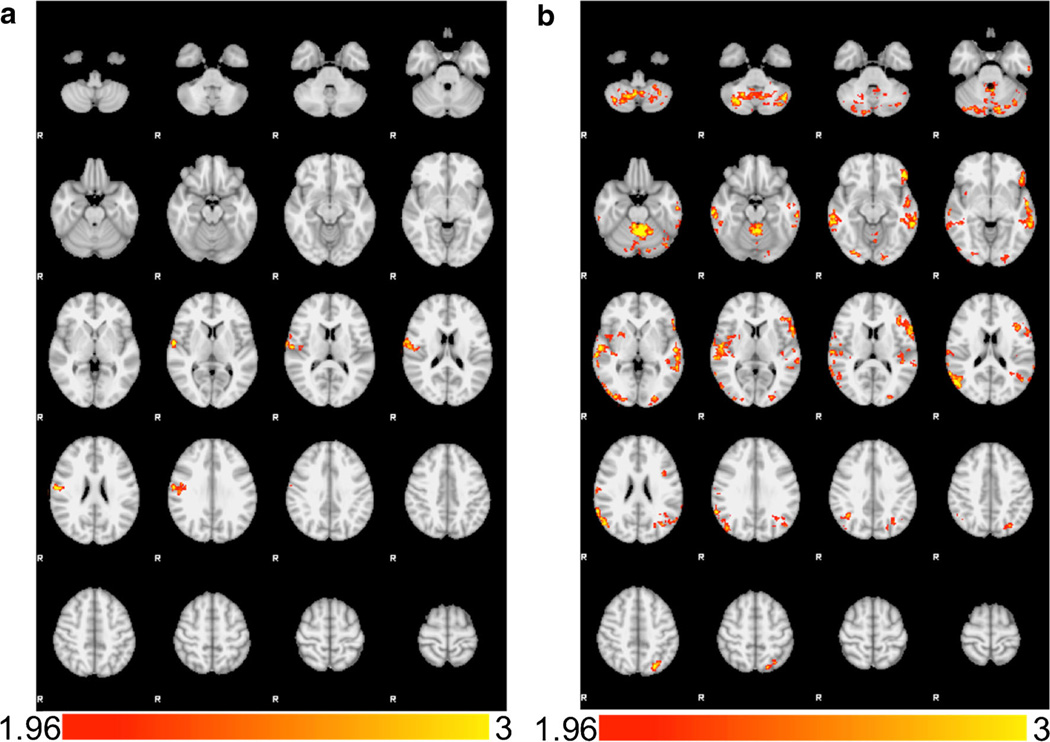
Fig. 2.
a Correlations with Body Mass Index (BMI). BMI was positively correlated with >BOLD activation in the HCB > LCB contrast in the right postcentral gyrus/central operculum. b Correlations with Insulin Resistance (HOMA-IR). Insulin resistance was positively correlated with BOLD activation in the HCB > LCB contrast in several regions including bilateral cerebellum, bilateral middle/superior temporal gyri, bilateral occipital poles, left orbitofrontal cortex, and left superior parietal lobe. Images are presented in radiological convention

