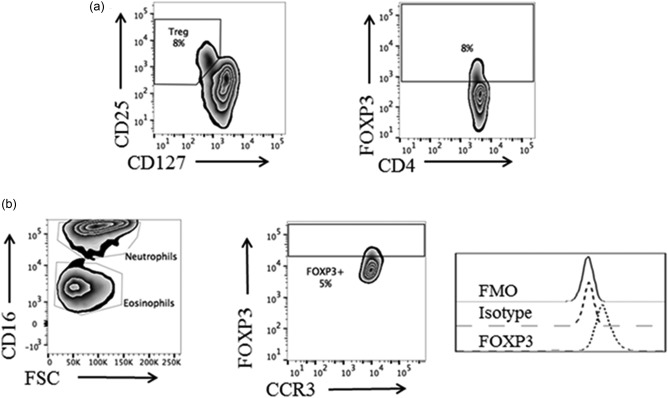
Figure 2.

Identification of forkhead box protein 3 (FOXP3)‐expressing eosinophils in whole blood by flow cytometry. (a) Gating and staining strategy to identify FOXP3‐expressing regulatory T cells (Tregs) in whole blood. (b) Gating strategy and representative flow cytometry plots derived from a healthy donor showing the percentage of FOXP3+ eosinophils and FOXP3 staining intensity, measured as median fluorescence intensity (MFI). Isotype and fluorescence‐minus‐one (FMO) controls are included.
