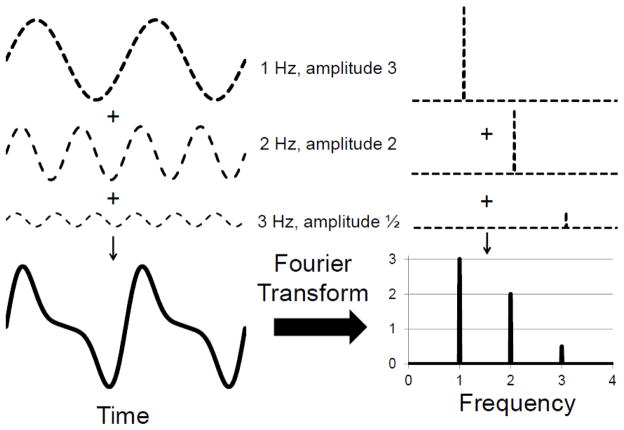
Figure 2. Frequency Analysis.
A rhythmic signal which appears complex when viewed in time can be better understood after its transformation to the frequency domain. The composite waveform on the left is the simple addition of three other oscillations of different frequencies and amplitudes. When viewed in the frequency domain, the amplitude spectrum (right) reveals very clearly the frequencies of the underlying rhythms and their relative contributions (amplitudes). The phase spectrum (not shown) gives information about when each oscillation occurs (i.e. is at 0°).

