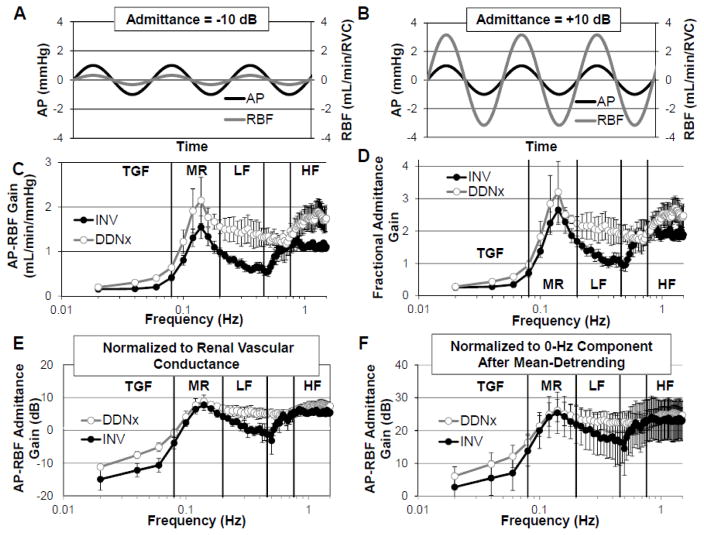
Figure 3. Renal Pressure-Flow Gain.
Representative AP and RBF oscillations depicting (A) buffering of AP oscillations by active renal vascular control mechanisms resulting in negative admittance gain and (B) amplification of AP oscillations by passive renal arterial elastance resulting in positive admittance gain. INV kidneys show lower LF gain whether quantified as (C) raw gain, (D) fractional admittance gain, or (E) admittance gain. (F) Erroneous normalization abolishes the ability of transfer function analysis to demonstrate physiology, be it autoregulation or the contribution of the renal nerves. Data adapted from (Schiller et al., 2016).

