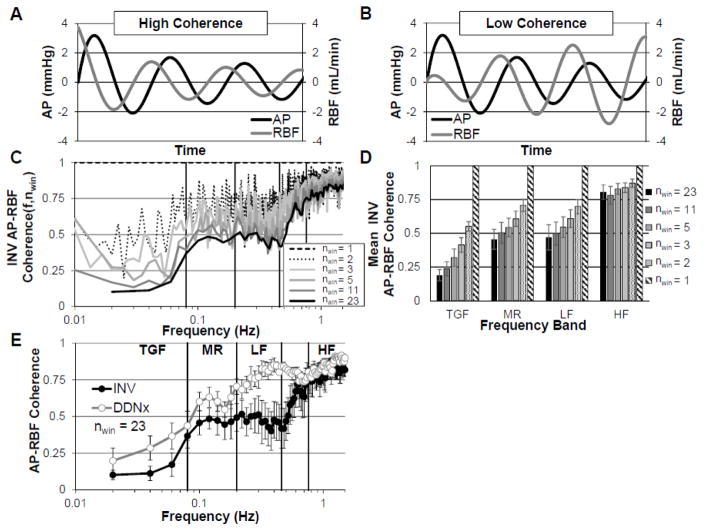
Figure 5. Renal Pressure-Flow Coherence.
Representative depictions of (A) a RBF oscillation with high coherence to the AP oscillation and (B) a RBF oscillation with low coherence to the AP oscillation. (C) Coherence depends on signal processing parameters and decreases with increasing number of windows. (D) Mean coherence over frequency bands for TGF, MR, LF, and HF, demonstrating the sensitivity of coherence to signal processing parameters. (E) Renal denervation selectively increases AP-RBF coherence in the LF range.
nwin, number of 50% overlapping windows used for Welch method. Data adapted from (Schiller et al., 2016).

