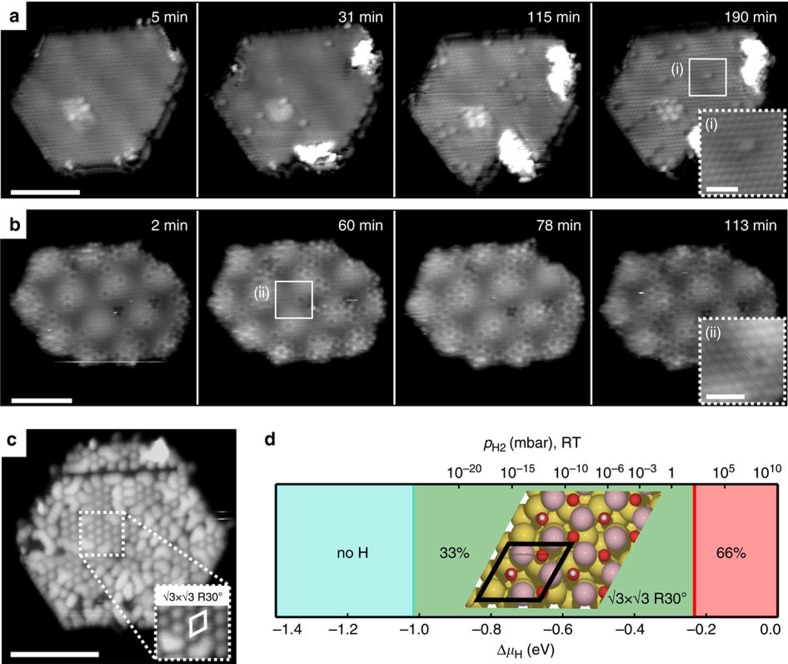
Figure 3. In situ STM movies and saturation level of hydroxylation.
(a,b) Image sequences from atom-resolved STM movie (supplementary) recorded during water exposure showing the initial stage of hydroxylation on single- (a) and double- (b) bilayer CoO nanoislands. The insets show high magnification atom-resolved STM images of hydroxyl groups on a single- (i) and double-bilayer (ii). (c) STM image of a heavily hydroxylated single bilayer island with areas of ordered  R30° superstructure. (d) DFT-calculated hydroxylation structure of the CoO basal plane as a function of H chemical potential and pressure at room temperature (upper scale). Scale bars: (a) 50 Å (inset 12 Å), (b) 50 Å (inset 6 Å), (c) 50 Å.

