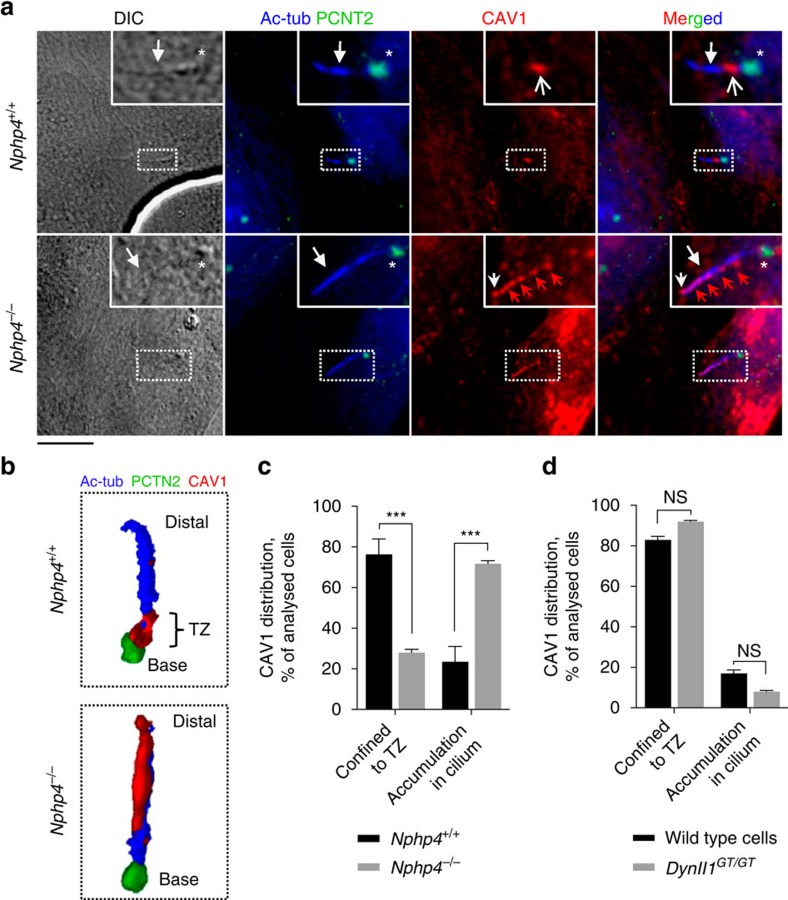
Figure 5. CAV1 TZ localization is disrupted in cells lacking NPHP4.
(a,b) IFM analysis of wild type (Nphp4+/+) and Nphp4−/− MEFs stained with CAV1 (red; open arrow) and PCTN2 (green; asterisk) antibodies. (c,d) Quantification of CAV1 staining patterns in Nphp4+/+ and Nphp4−/− MEFs (c), and in wild type and Dynll1GT/GT MEFs (d). At least 30 cells were analysed per condition (n=3). Bars represent mean±s.e.m. P values result from two-way ANOVA followed by Sidak's multiple comparison (***, P≤0.001; NS, P≥0.05, not significant). Scale bar: 5 μm.

