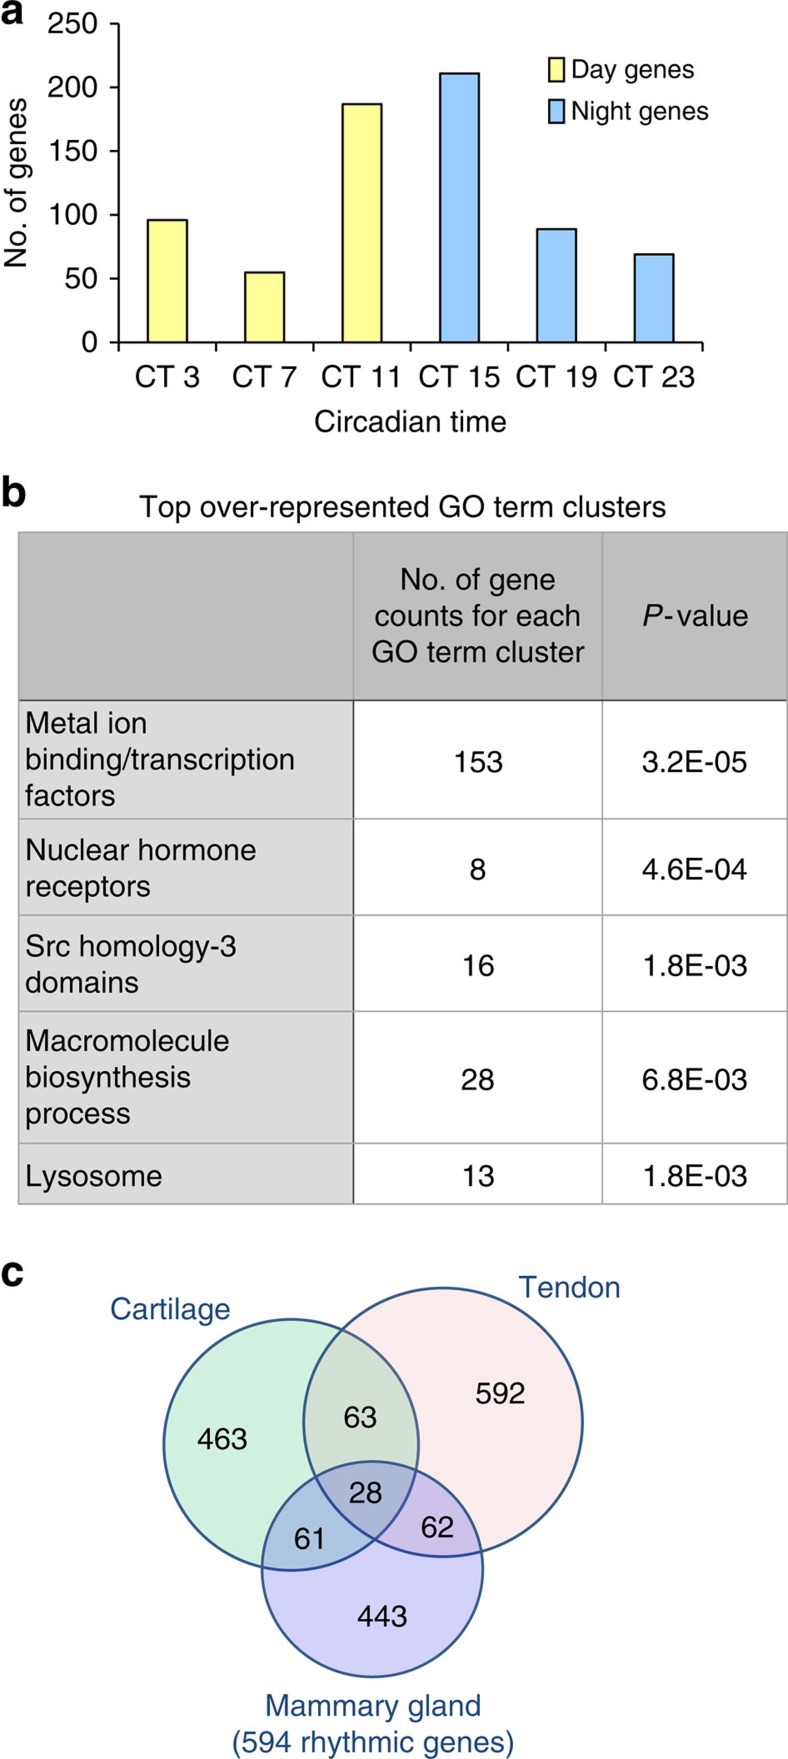
Figure 2. Analysis of the rhythmic mouse mammary gland transcriptome.
(a) Rhythmic mammary genes exhibited large-phase clusters at CT11 and CT15 (around the day/night transition). (b) GO-term analysis of circadian genes using DAVID. (c) Venn diagram compares the number of circadian genes of mammary gland, cartilage and tendon. These tissues were isolated from the same mouse strain under identical experimental conditions. The analysis algorithm and criteria were also identical. Note there is only ∼10–15% overlap among tissues.

