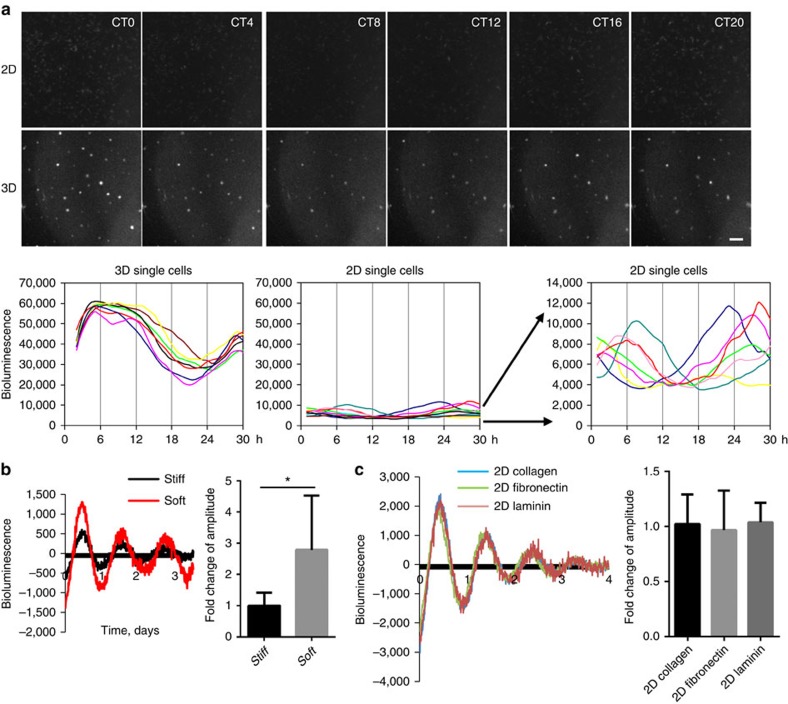
Figure 6. The mammary clock is cell autonomous and regulated by stiffness.
(a) Top: real-time bioluminescence imaging of primary MEC cells cultured as single cells at lower density, either on 2D or in 3D ECM. Bottom: quantification of bioluminescence signals from individual MECs cultured on either 2D or 3D. N=3 animals, scale bar=100 μm. (b) Primary MECs have stronger oscillations in a soft alginate matrix compared with a stiff alginate matrix. Left: PER2::Luc oscillations. Right: quantification of circadian amplitude. Student's t-test, mean±s.e.m., *P< 0.05, n=4 animals. (c) Representative PER2::Luc traces from primary MECs cultured on petri-dishes coated with collagen I (10 μg ml−1), fibronectin (20 μg ml−1) or laminin (10 μg ml−1). Quantification shows no significant difference among these three conditions, one-way ANOVA, mean±s.e.m., n=3 animals.

