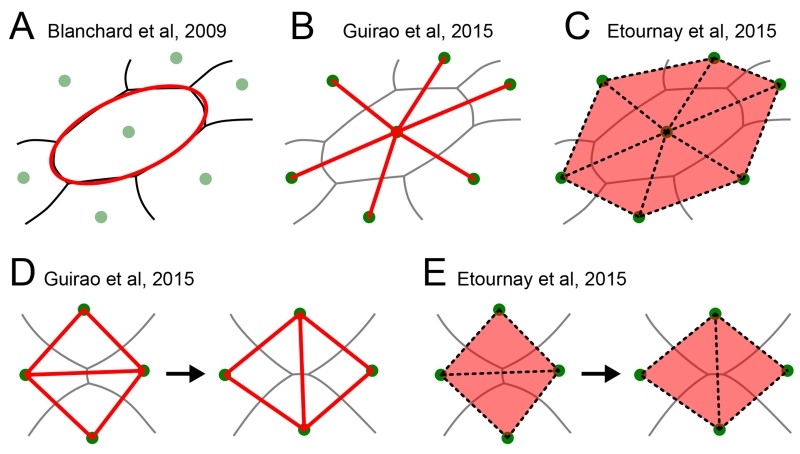
Figure 2.
Different methods to quantify cellular contributions to large-scale tissue deformation use different ways to measure cell shape. (A) Blanchard et al. fit the cell outline to an ellipse (red). Aspect ratio and angle of the ellipse are then used to characterize cell shape. (B) Guirao et al. define cell shape based on the connection lines (red) between neighboring cell centers (green dots). (C) Etournay et al. characterize cell shape based on triangles (red) whose corners are three neighboring cell centers (green dots). (D,E) Guirao et al. and Etournay et al. account for cell neighbor exchanges by addition and removal of either cell center connection lines or triangles, respectively. In all panels, gray lines represent cell-cell interfaces, green dots are cell centers, and the structures used to quantify cell shape are shown in red, respectively.

