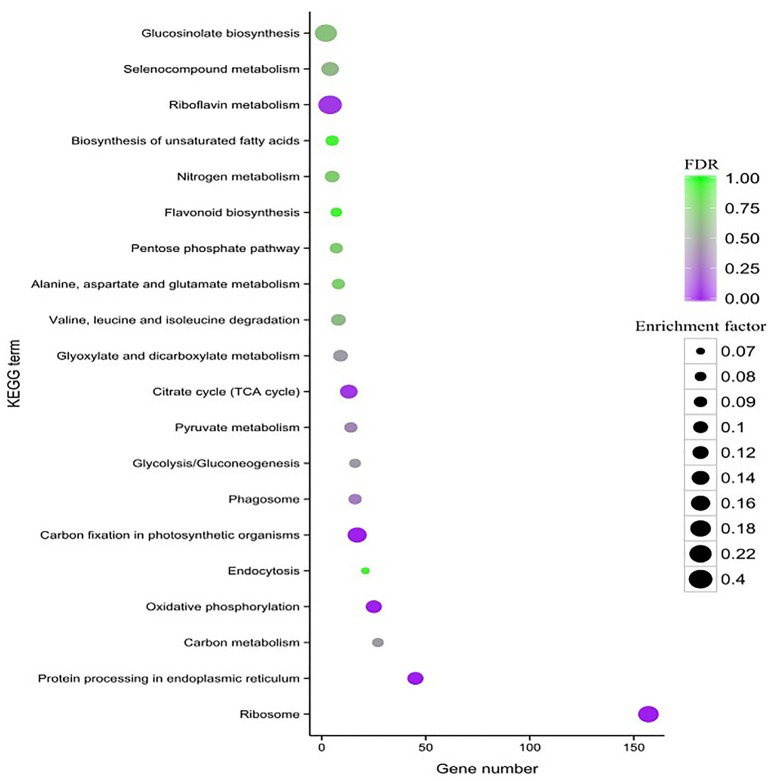
Figure 6.
KEGG pathway enrichment scatter diagram of DEGs. Only the top 20 most strongly represented pathways are displayed in the diagram. The degree of KEGG pathway enrichment is represented by an enrichment factor, the FDR value, and the number of unigenes enriched in a KEGG pathway. The enrichment factor indicates the ratio of differential expression unigenes enriched in this pathway to the total number of annotated unigenes in this pathway. The names of the KEGG pathways are listed along the y-axis. The FDR value indicates the corrected p-value, ranging from 0 to 1, and an FDR value closer to 0 indicates greater enrichment.

