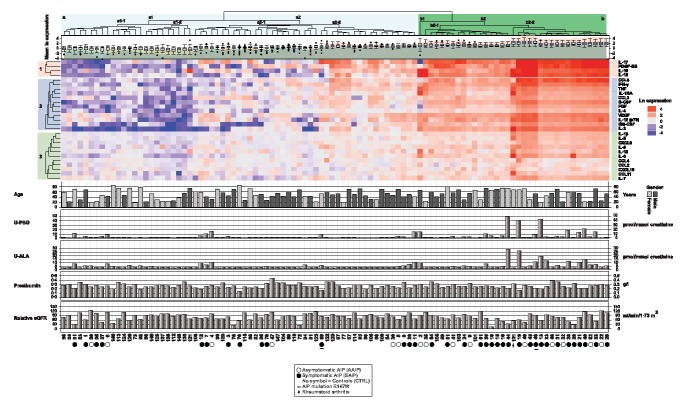
Figure 2.

Hierarchical cluster analysis of cytokines in acute intermittent porphyria (AIP) cases and matched controls. The cytokine levels in each AIP case and matched controls were divided on the median levels of each cytokine in the 50 matched controls. The matrix results were then transformed using natural logarithm. The ln expression levels of individual cytokines are represented by a colour scale, with high values in red, intermediate levels in white and low cytokine levels in blue. The cluster analysis was performed using r with Euclidian distance and complete clustering. The main clusters of AIP cases and controls are named (a) and (b), and the subclusters are named (a1), (a2), (b1) and (b2) on the dendrogram. The cytokines clustered into three clusters named 1, 2 and 3. The mean ln expressions of all the cytokines levels are given as box‐plots below the dendrogram. The age in years, gender, U‐porphobilinogen (U‐PBG) and U‐ALA ratio expressed as µmol/mmol creatinine, pre‐albumin (g/l) and the relative estimated glomerular filtration rate (eGFR) Chronic Kidney Disease Epidemiology Collaboration (CKD‐EPI) (ml/min/1·73 m2) based on cystatin C levels, are shown as a bar graphs below the heatmap for each AIP case and control. Asymptomatic (open circles) and symptomatic (filled circles) AIP cases are indicated below the heatmap, those with the R167W mutation are indicated with underscored symbols.
