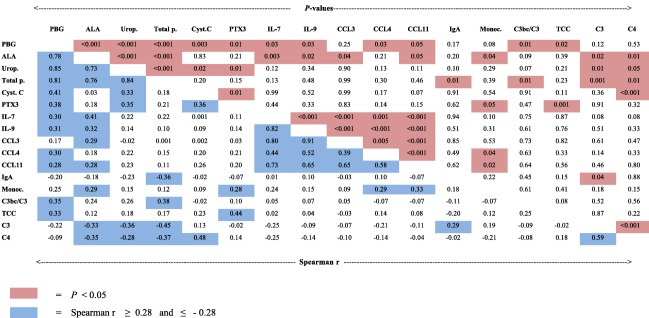
Figure 3.

Correlation matrix of porphyrins and precursors, biomarkers of inflammation and kidney function. The data in the left lower part are Spearman's correlation coefficients, r, in the acute intermittent porphyria group (n = 50), r ≥ 0·28 and r ≤ −0·28 (blue colour). The pairwise correlation between the different variables is depicted. The corresponding significant P‐values (P < 0·05) are indicated by red colour in the upper right part. The following variables were included: urine porphobilinogen ratio (PBG); urine 5‐aminolevulinic acid ratio (ALA); uroporphyrin (Urop.); total porphyrins (Total p.); serum cystatin C (Cyst. C); plasma long pentraxin 3 (PTX3); interleukin (IL)‐7 and ‐9; chemokine ligand (CCL) 3, 4 and 11; serum immunoglobulin A (IgA); blood (B) monocyte count (Monoc.); serum C3bc/C3 ratio (C3bc/C3); the plasma levels of the terminal complement complex (TCC); complement C3 and C4.
