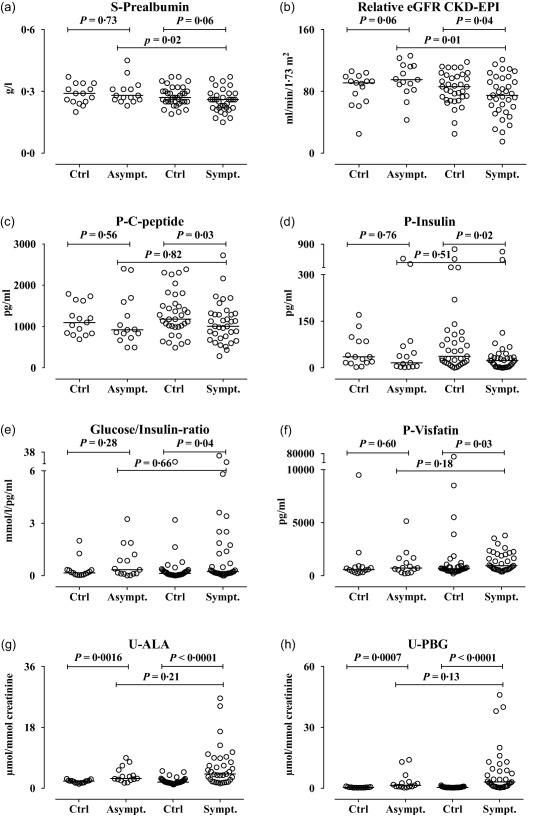
Figure 4.

Prealbumin levels, kidney function, C‐peptide, insulin and glucose/insulin ratio, visfatin and porphyrin precursor levels in asymptomatic (Asympt.) and symptomatic (Sympt.) acute intermittent porphyria (AIP) cases compared with controls (Ctrl). (a) Serum prealbumin levels (g/l), (b) relative eGFR (estimated glomerular filtration rate) Chronic Kidney Disease Epidemiology Collaboration (CKD‐EPI) (ml/min/1·73 m2), (c) plasma C‐peptide (pg/ml), (d) plasma insulin (pg/ml), (e) glucose/insulin ratio (mmol/l/pg/ml), (f) plasma visfatin levels (pg/ml), (g) urine delta‐amino levulinic acid (ALA, µmol/mmol creatinine), (h) urine porphobilinogen (PBG, µmol/mmol creatinine), in asymptomatic (Asympt.) and symptomatic (Sympt.) acute intermittent porphyria cases compared with their respective matched controls (Ctrl). Prealbumin, cystatin C, C‐peptide, insulin and visfatin were analysed using immunoassays. Glucose, ALA and PBG were analysed using standard biochemical assays. The results from the age‐ and sex‐matched controls (n = 50; of these 35 were controls for the symptomatic cases) and the cases with AIP (n = 50, 35 symptomatic) are shown as scatter‐plots with the median. The paired data were analysed using the Wilcoxon's matched‐pairs signed‐rank test. The asymptomatic and symptomatic AIP cases were compared using the Mann–Whitney U‐test.
