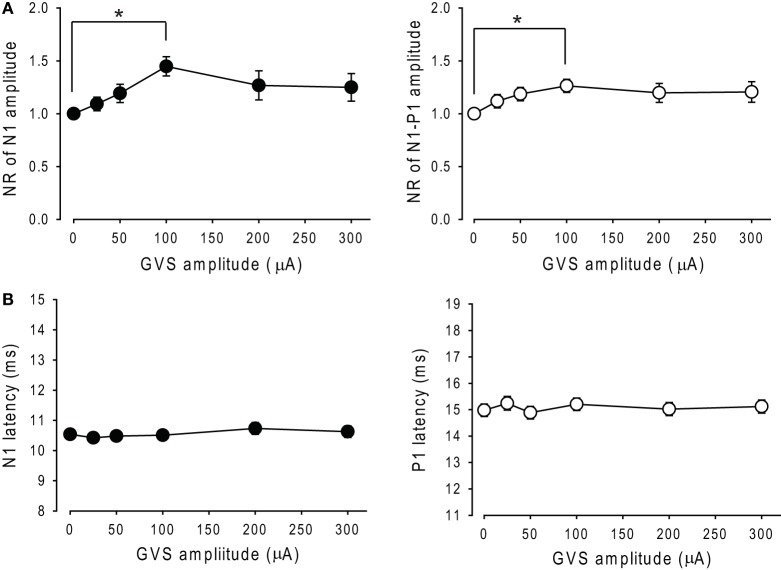
Figure 4.
Changes in the amplitude and latency of oVEMPs to bone-conducted vibration during application of noisy galvanic vestibular stimulation (GVS). (A) Changes in the normalized ratio of N1 amplitude (left panel) and N1–P1 amplitude (right panel) of oVEMP responses during application of noisy GVS in 34 ears. Mean ± 1 SEM is shown. *p < 0.05. (B) Changes in N1 latency (left panel) and P1 latency (right panel) of oVEMP responses during application of noisy GVS in 34 ears.

