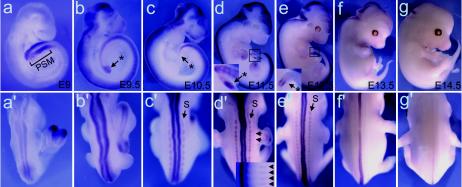
FIG. 3.
Whole-mount in situ hybridization showing a dynamic Btg2 expression pattern in PSM-tail bud regions, somites, and the neural tubes. Lateral (a to b) and dorsal (a′ to g′) views of E9 to E14.5 embryos hybridized with Btg2 antisense probe are shown. Btg2 transcripts were specifically detected in the PSM region at E9 (a) and in the tail buds (indicated by asterisks) at subsequent stages (b to e). Tail bud-specific expression disappeared from E13.5 embryos (f and g). Btg2 transcripts were detected also on the dorsal side of the neural tubes from E9 to E13.5. This neural tube expression peaked at E11.5 and faded away by E13.5. Expressions in the somite (S) were also visible in E10.5 to E12.5 embryos. The inset in panel d′ shows Btg2 expression in developing rib-like streaks in the trunk at E11.5.

