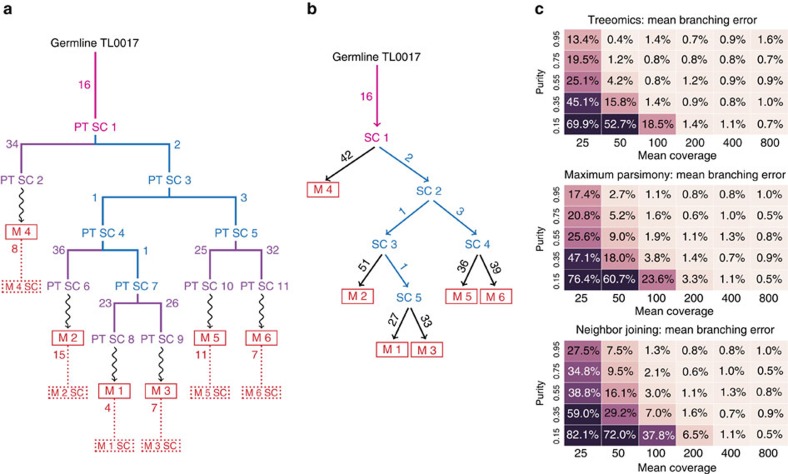
Figure 3. Simulated tumour phylogenies illustrate challenges in reconstructing metastatic seeding patterns.
(a) Simulated metastatic progression according to a stochastic branching process51,52. Metastases (M 1-6) are numbered in chronological order of their seeding. Purple and blue lines indicate evolution among lineages within the primary tumour (PT). Pink numbers correspond to the founding variants present in all cancer cells and blue numbers correspond to the parsimony-informative variants. Numbers in red denote subclonal variants acquired after the seeding of the metastasis. SC indicates subclone. Dotted boxes illustrate biopsies. (b) Treeomics correctly reconstructed the simulated phylogeny in panel a by identifying the parsimony-informative variants (blue). Private mutations (purple numbers in panel a) acquired in the primary tumour are indistinguishable from subsequently acquired mutations (red numbers in panel a). (c) Benchmarking across 15,000 simulated phylogenies with six monophyletic metastases depicting the mean branching error conditioned on at least one variant per branch. Phylogenies reconstructed from low coverage WES data or from samples with very low neoplastic cell content exhibited high error rates independent of the used method. Necessary binary present/absent classification for maximum parsimony and neighbour joining was based on Treeomics' Bayesian inference model (variant was present if p>50%).

