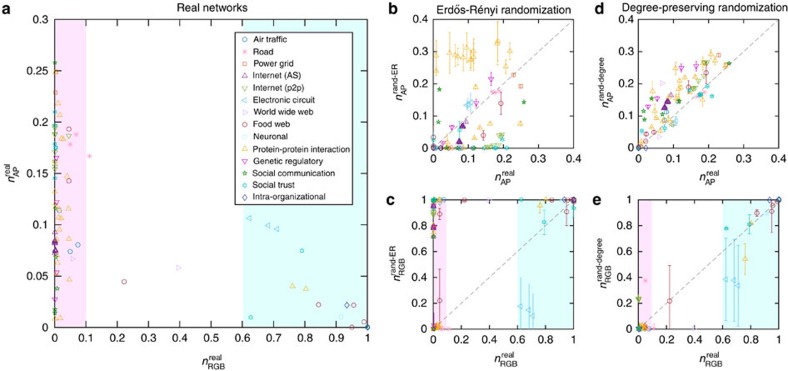
Figure 2. Articulation points and the residual giant bicomponent in real networks.
(a) Fraction of articulation points  versus relative size of the residual giant bicomponent
  is plotted for a wide range of real networks, from infrastructure networks to technological, biological, and social networks. Most of the real networks analysed here have either a very small residual giant bicomponent or a rather big one (highlighted in light magenta and turquoise, separately). (b,c) Fraction of articulation points
  and relative size of the residual giant bicomponent
  , obtained from the fully randomized counterparts of the real networks, compared with the exact values (
 and
and  ). (d,e) Fraction of articulation points
  and relative size of the residual giant bicomponent
  , calculated from the degree-preserving randomized counterparts of the real networks, compared with the exact values (
 and
and  ). In b–e, all data points and error bars (standard error of the mean or s.e.m.) are determined from 100 realizations of the randomized networks, and the dashed lines (y=x) are guide for eyes. For detailed description of these real networks and their references, see Supplementary Note 7; Supplementary Tables 1–14.

