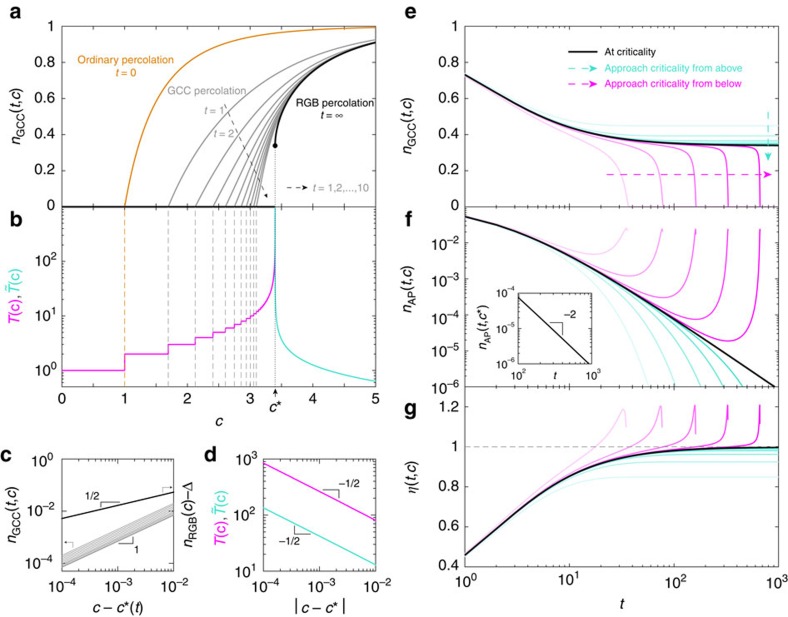
Figure 4. Percolation transitions associated with greedy articulation points removal.
Two types of percolation transitions of different nature are shown for Erdős-Rényi random networks. (a) Relative size of the giant connected component (GCC) after t steps of greedy articulation points removal (GAPR), nGCC(t, c), as a function of the mean degree c. Note that nGCC(0, c) corresponds to the ordinary percolation (orange line); nGCC(t, c) with finite t (only t=1, 2,..., 10 are shown here) corresponds to the GCC percolation (grey lines); and nGCC(∞, c)=nRGB(c) corresponds to the residual giant bicomponent (RGB) percolation (thick black line). (b) Total number of the GAPR steps T(c) for c<c* (magenta line) and the characteristic number of the GAPR steps  for c>c* (turquoise line) as functions of the mean degree c. (c) The critical scaling behaviour of nGCC(t, c) and nRGB(c) for the GCC and RGB percolation transitions, respectively. (d) The divergence of T(c) and
  associated with the RGB percolation transition. (e–g) Temporal behaviours of fraction of the GCC (nGCC(t, c)), fraction of APs (nAP(t, c)), and average number of newly induced APs per single AP removal η(t, c) at critical (black lines), subcritical (magenta lines, c−c*=−24 × 10−5, −26 × 10−5, −28 × 10−5, −210 × 10−5, −212 × 10−5, respectively) and supercritical (turquoise lines, c − c*=24 × 10−5, 26 × 10−5, 28 × 10−5, 210 × 10−5, 212 × 10−5, respectively) regions of the RGB percolation transition. At criticality, nAP(t, c*) decays in a power-law manner for large t (inset of f).

