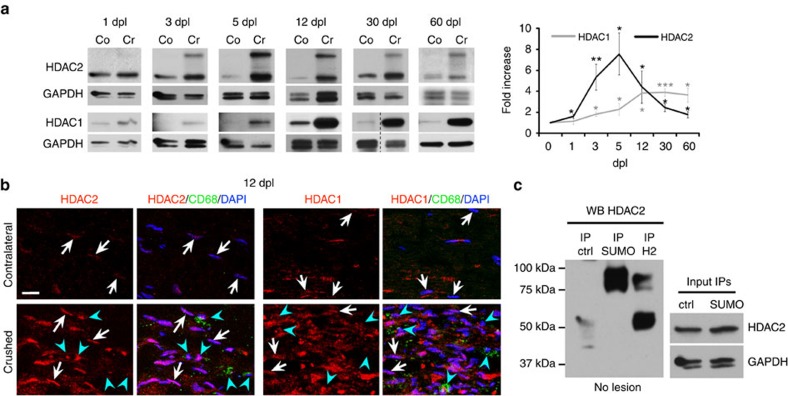
Figure 1. HDAC1/2 are robustly upregulated in SCs after lesion.
(a) Western blots of HDAC2 and HDAC1 in lysates of crushed (Cr) and contralateral (Co) nerves of adult mice at 1 dpl (n=5), 3 dpl (n=5), 5 dpl (HDAC2, n=6; HDAC1, n=7), 12 dpl (HDAC2, n=6; HDAC1, n=8), 30 dpl (HDAC2, n=6; HDAC1, n=8) and 60 dpl (n=6), and quantification normalized to GAPDH and compared to Co=1, showing HDAC1/2 upregulation after lesion. Of note: both bands detected by the HDAC2 antibody were quantified and added together in the graph. (b) Co-immunofluorescence of HDAC2 or HDAC1 (red) with CD68 (green=macrophages) and DAPI labelling (blue=nuclei, overlay appears pink) at 12 dpl, showing upregulation in SCs (CD68-negative cells with elongated nuclei, white arrows) of crushed compared to contralateral nerves. Note that macrophages (CD68-positive cells, blue arrowheads) express variable levels of HDAC1 and HDAC2. Scale bar, 10 μm. (c) Denaturing IP of SUMO-1, HDAC2 (H2) or control Flag (ctrl) in unlesioned (no lesion) adult mouse sciatic nerve lysates, and western blot of HDAC2, showing that the ∼75 kDa band detected by the HDAC2 antibody corresponds to a SUMOylated form of HDAC2. HDAC2 and GAPDH western blots on lysates used for IP show the inputs. Representative photos of three independent experiments are shown. One-tailed (HDAC2, 12 dpl and 60 dpl; HDAC1, 5 dpl) or two-tailed Student's t-tests, unpaired (HDAC2: 3 dpl) or paired, P values: *P<0.05, **P<0.01, ***P<0.001. Values, mean; error bars, s.e.m.

