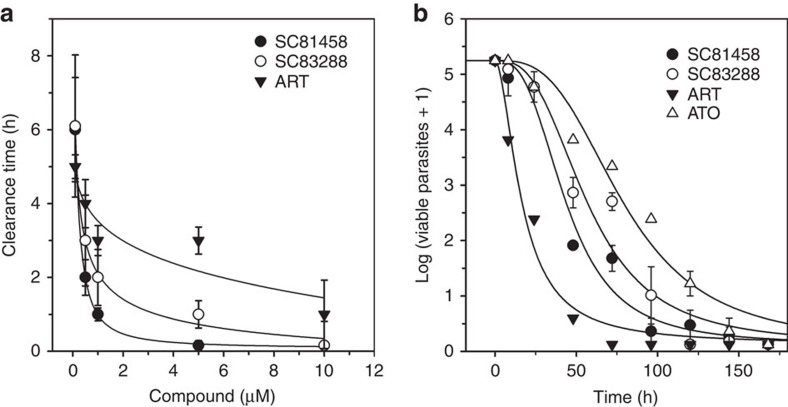
Figure 4. In vitro killing kinetic profile of SC81458 and SC83288.
(a) Concentration and exposure time-dependent clearance of a 0.5% parasitemia of trophozoites. The following drugs were investigated: artemisinin (ART, closed inversed triangles), SC81458 (closed circles) and SC83288 (open circles). (b) The graph shows the change in the number of viable parasites over time after exposure to ART (closed inversed triangles; 19 nM), atovaquone (ATO, open triangles; 10 nM), SC81458 (closed circles; 80 nM), and SC83288 (open circles; 30 nM) at a concentration corresponding to 10 times their respective IC50 values. The mean±s.e.m. are shown for at least four independent replicates.

