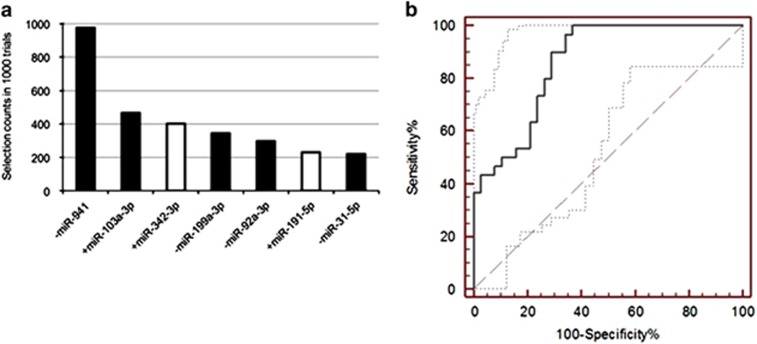
Figure 2.
(a) The Greedy Algorithm was applied to 1000 selections of random 80% subsets of nonprogressed subjects and random 80% subsets of progressed subjects. Each time up to six markers could be chosen. The seven most frequently chosen markers are shown with their selection rates. The solid bars indicate the five markers that were also selected in the first six markers chosen by the Greedy Algorithm for the full data set (Figure 1), yielding as a sum of z-scores the classifier function in sum (equation (1)). This function applied to the full data yields AUC=0.86. (b) ROC of the five-miRNA classifier function (equation (1)). Dotted lines are 95% confidence levels, and the dashed line is hypothetical performance of a random classifier. AUC, area under the curve; miRNA, microRNA; ROC, receiving operating characteristics.

