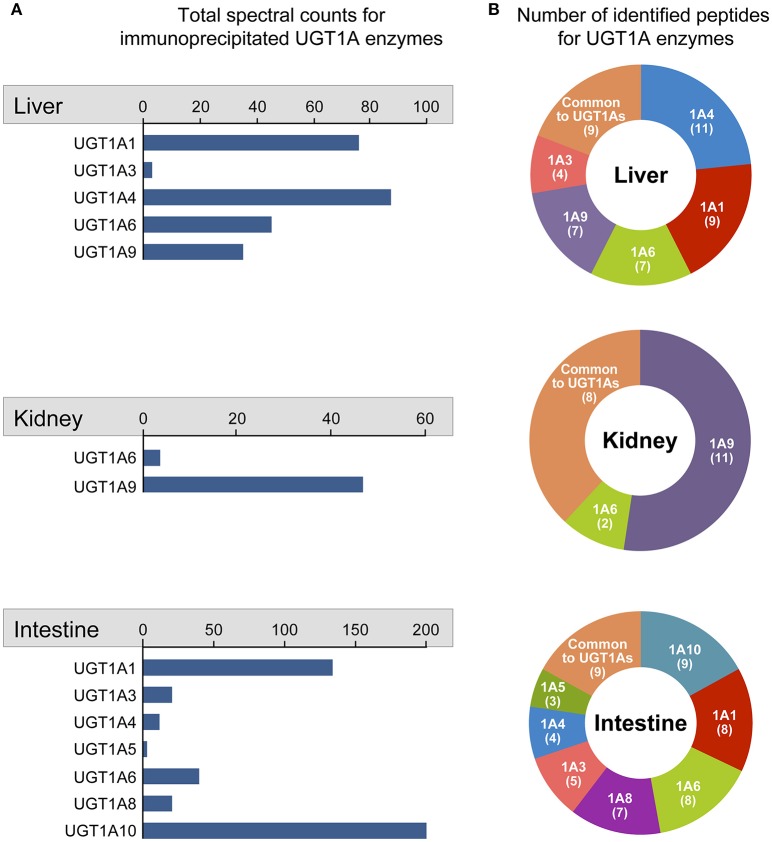
Figure 2.
Quantitative overview of UGT1A enzymes immunoprecipitated from each tissue. Identification of immunoprecipitated UGT1A enzymes was based on the detection of peptides unique to specified UGT1A enzymes. (A) The quantitative assessment of each immunoprecipitated UGT1A is given by the total number of spectral counts for peptides unique to each UGT1A identified by mass spectrometry. Total spectral counts for peptides common to all UGT1A enzymes (Liver: 465; Kidney: 67; Intestine: 1561) were not considered in the quantitative assessment of specific UGT1As. (B) For each tissue, the number of peptides unique to each UGT1A identified by MS/MS analysis is represented in ring charts. Detailed quantification and unique/common UGT1A peptides identified are presented in Supplementary Table 1.

