Figure 5.
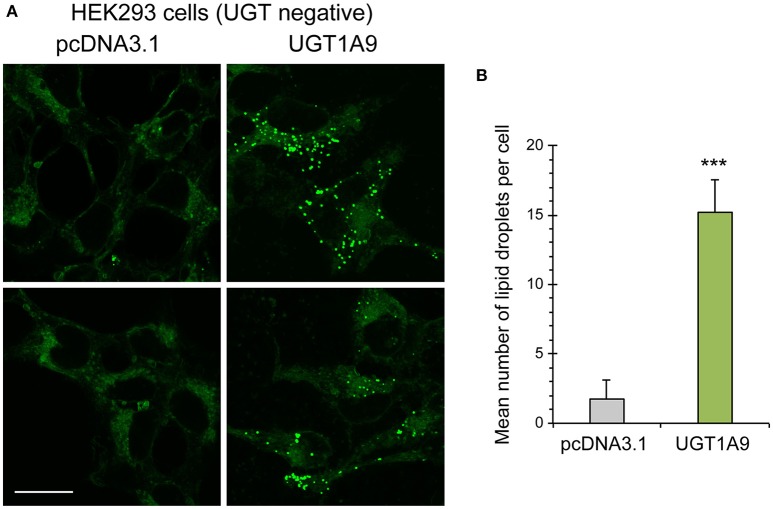
Accumulation of cellular lipid droplets in UGT1A9 expressing HEK293 cells. (A) Representative images of lipid droplets (green fluorescence) stained with Nile Red in HEK293-UGT1A9_myc-his or control HEK cells (stably transfected with the empty pcDNA3.1 vector—UGT negative cells). Bar = 20 μm. (B) Average number of lipid droplets per cell stably expressing UGT1A9 or control HEK cells. Lipid droplets per cell were counted in at least 140 cells per condition and averaged (n = 3 independent experiments).

