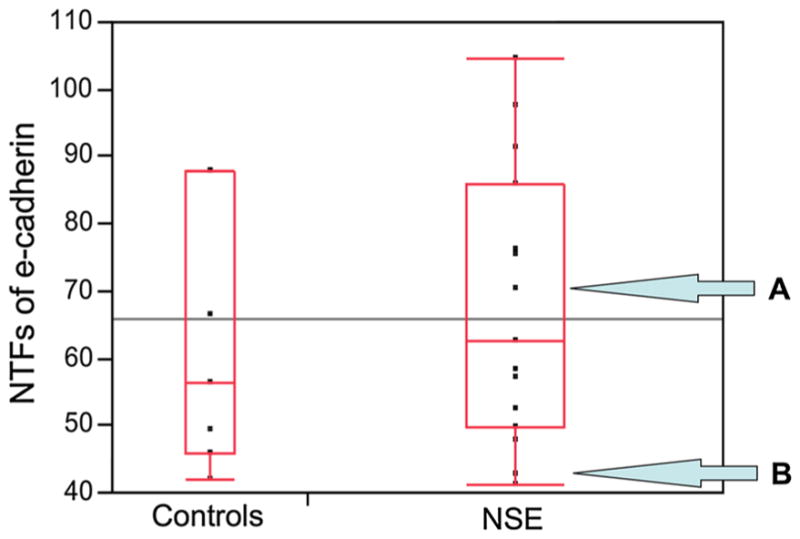
Fig. 3.

Boxplot of serum NTF levels from patients with NSE compared to serum NTF levels from healthy controls. The lines within each box represent the median values of each group. Levels obtained using enzyme-linked immunosorbent assay of N-terminal fragments (NTFs) of e-cadherin in sera from patients with neosquamous epithelium (NSE) and healthy controls, p > 0.05. Note: Patient A had a pathologically high acid contact time on esophageal pH monitoring (24.3 %) in association with the high level of NTFs in serum (70.4 pg/mL) and patient B had a normal acid contact time on pH monitoring (1.5 %) in association with a normal level of NTFs (42.7 pg/mL) in serum
