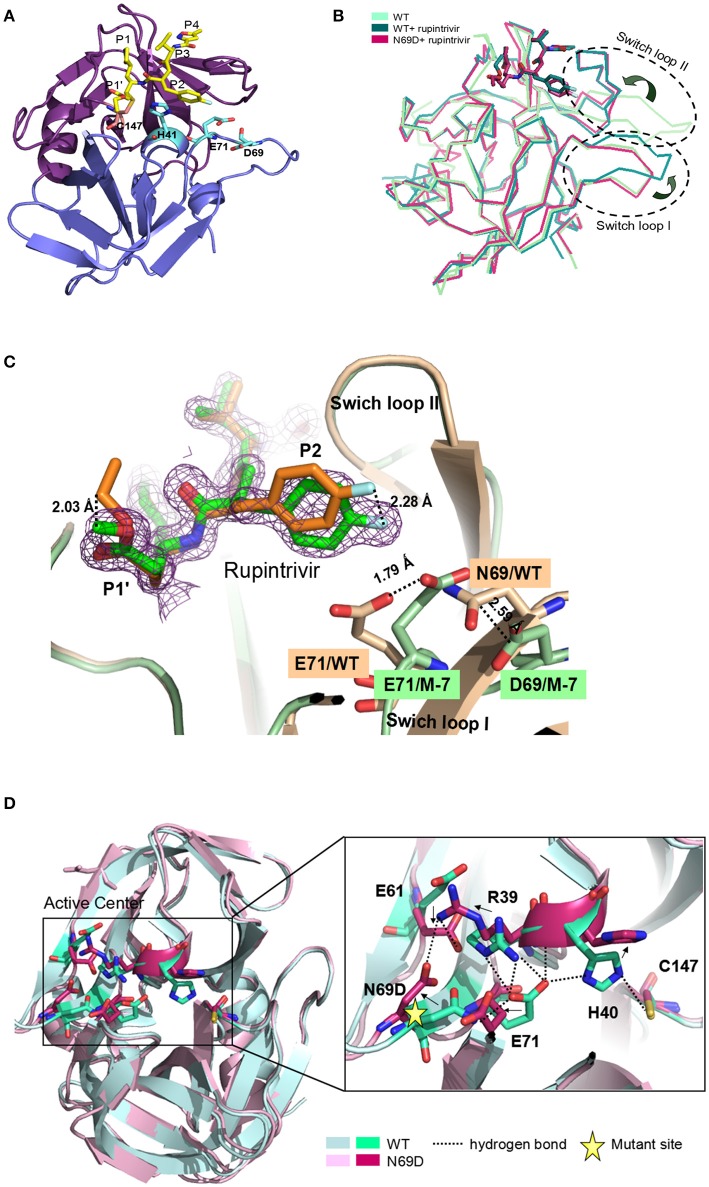
Figure 2.
Crystal structure of 3Cpro N69D with rupintrivir. (A) Overall view of 3Cpro N69D-rupintrivir complex. Rupintrivir was shown as yellow sticks. (B) Binding of rupintrivir leads to different conformational changes for 3C and 3C N69D. The structure of WT 3C with or without rupintrivir (PDB no: 4GHT and 3OSY) are shown in blue and cyan, respectively. The 3C mutant N69D (PDB no: 5WQ2) is colored with hot pink. Two regions, responsible for substrate binding, are marked with dotted ovals and labeled as “Switch loop I” and “Switch loop II.” (C) Structural comparison of WT 3C-rupintrivir and 3C N69D-rupintrivir (PDB no: 4GHT and 5WQ2). WT 3C-rupintrivir and 3C N69D-rupintrivir are shown in yellow and green, respectively. Rupintrivir, Glu71, and Asp69/Asn69 are shown in the stick model. The 2.8-Å uplift of the P2 group of rupintrivir in 3C N69D relative to the position in WT 3C is indicated. The shifts of the positions of Glu71 and Asp69/Asn69 are marked and the distances between residues are annotated. (D) The N69D mutation leads to radical structural changes in the active center of 3Cpro. Structural superposition of native 3C and 3C N69D was shown in cartoon model and residues in the active site are shown in stick model. Native 3C and 3C N69D are rendered in blue and pink, respectively. The hydrogen bond network of the active site of WT 3C is indicated with dashed lines. Residues involved in the hydrogen bond network of the active site are annotated. The shifts in the position of residues in active center are indicated with arrows.

