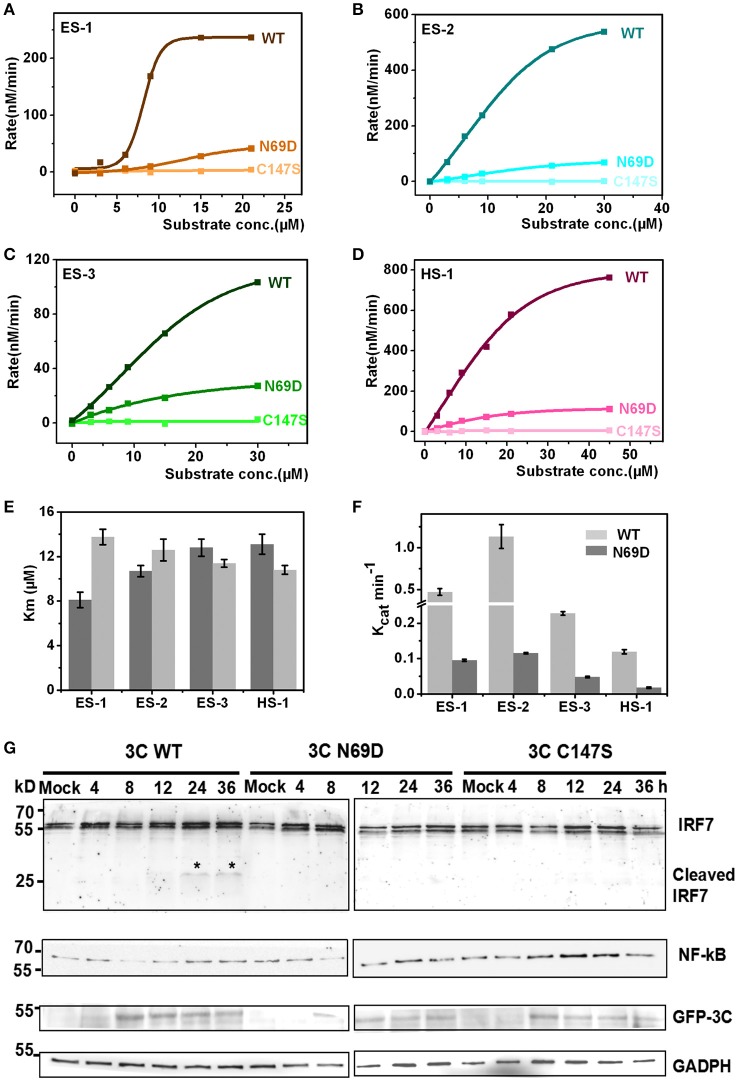
Figure 3.
Catalytic activities of native 3C and 3C N69D tested in vitro and in vivo. (A) The enzyme kinetics of native 3C and 3C N69D for the ES-1 peptide. The description of the fluorescence-labeled peptides is listed in Table S2. The concentration of the protease was 0.5 μM for all experiments. The initial velocities of the protease under a variety of different substrate concentrations were plotted against substrate concentrations to obtain the Vmax and Km values of the enzyme. The kinetic data were fitted with the Michaelis-Menten equation. (B–D) show the enzyme kinetics of WT 3C and 3C N69D to the ES-2 peptide, ES-3 peptide, and HS-1 peptide, respectively. Three independent measurements were performed. (E,F) Comparison of Km and Kcat for the different substrates. Km and Kcat (Vmax/[E]) were determined respectively. Error bars depict the standard deviation (S.D., n = 3). (G) Effect of WT 3C and 3C N69D on IRF7 and NF-κB in 293T cell. 293T cells were transfected with GFP or GFP-3C variants as indicated. The intracellular IRF7 and NF-κB was detected using immunoblotting by corresponding antibody at different times after transfection. GAPDH was included as an internal control.

