
FIGURE 3.
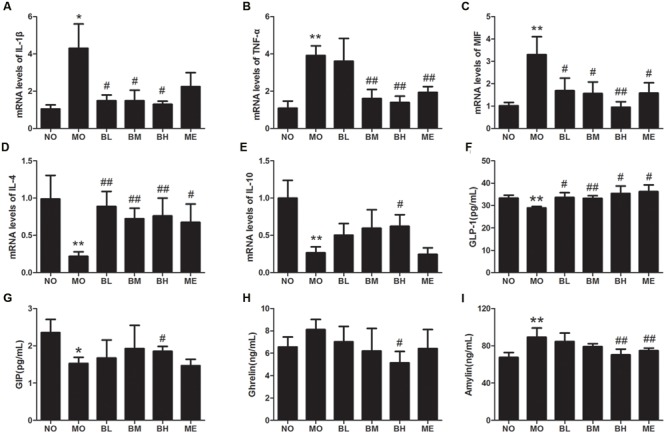
Berberine affected mRNA expressions of intestinal cytokines and plasma gastrointestinal hormones. (A) IL-1β mRNA levels. (B) TNF-α mRNA levels. (C) MIF mRNA levels. (D) IL-4 mRNA levels. (E) IL-10 mRNA levels. (F) Plasma GLP-1 concentrations. (G) Plasma GIP concentrations. (H) Plasma Ghrelin concentrations. (I) Plasma Amylin concentrations. The levels of mRNA were expressed relative to the β-actin. Data presented as mean ± SD. n = 6 for each group. *P < 0.05 vs. NO group, **P < 0.01 vs. NO group, #P < 0.05 vs. MO group, ##P < 0.01 vs. MO group.