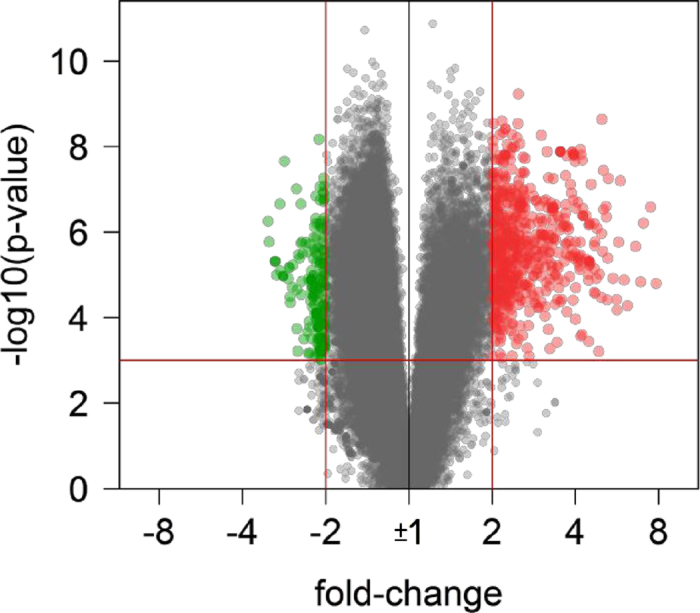
Figure 1. Volcano plot of gene expression changes.

The transcriptome of circulating CD4+ cells from RRMS patients receiving fingolimod therapy for 3 months was compared to baseline. The x-axis specifies the fold-changes (FC) and the y-axis specifies the negative logarithm to the base 10 of the t-test p-values. Red vertical and horizontal lines reflect the filtering criteria (FC = ±2.0 and p-value = 0.001). FC > +2.0 indicates transcript levels increased by >100%, whereas FC < −2.0 indicates transcript levels reduced by >50%. Red and green dots represent probe sets for transcripts expressed at significantly higher (n = 618) or lower (n = 272) levels during therapy, respectively.
