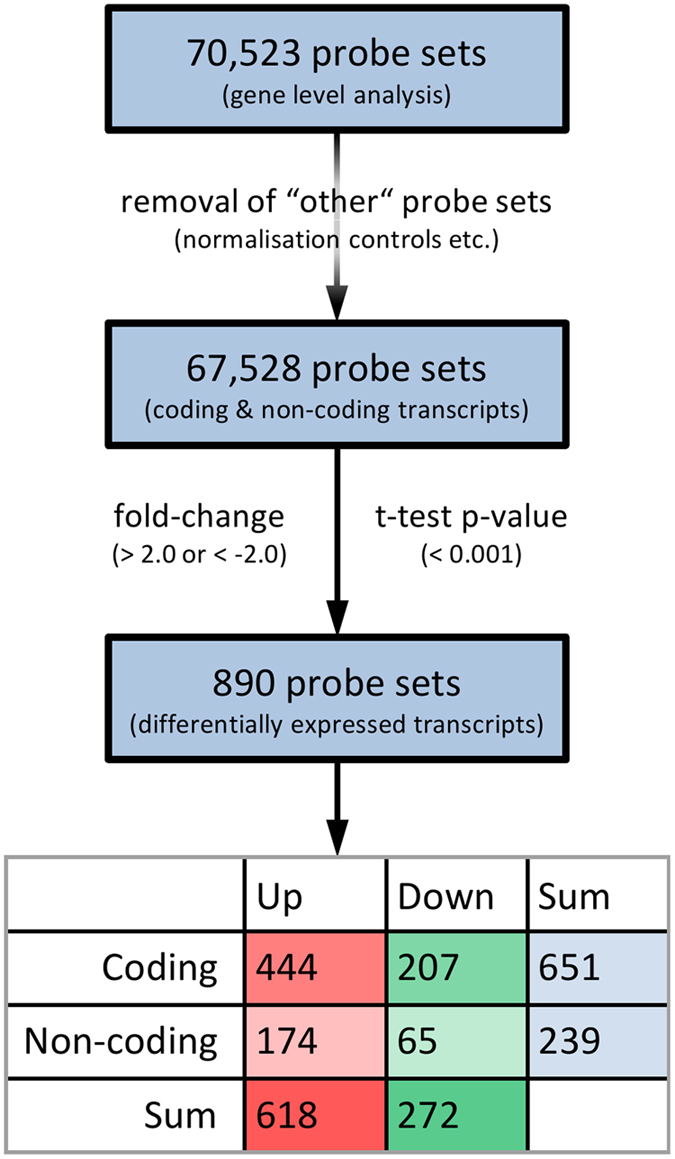
Figure 2. Identification of differentially expressed genes in CD4+ cells.

In total, 890 probe sets were filtered when comparing the transcript levels after 3 months of therapy with the pre-treatment levels. This figure shows the number of all gene level probe sets (top), the number of probe sets after removal of normalisation controls (middle) and the number of probe sets for differentially expressed transcripts satisfying t-test p-value < 0.001 and fold-change > + 2.0 or <−2.0 (bottom). The table is giving the numbers of up-regulated (green) or down-regulated (red) and coding or non-coding transcripts.
