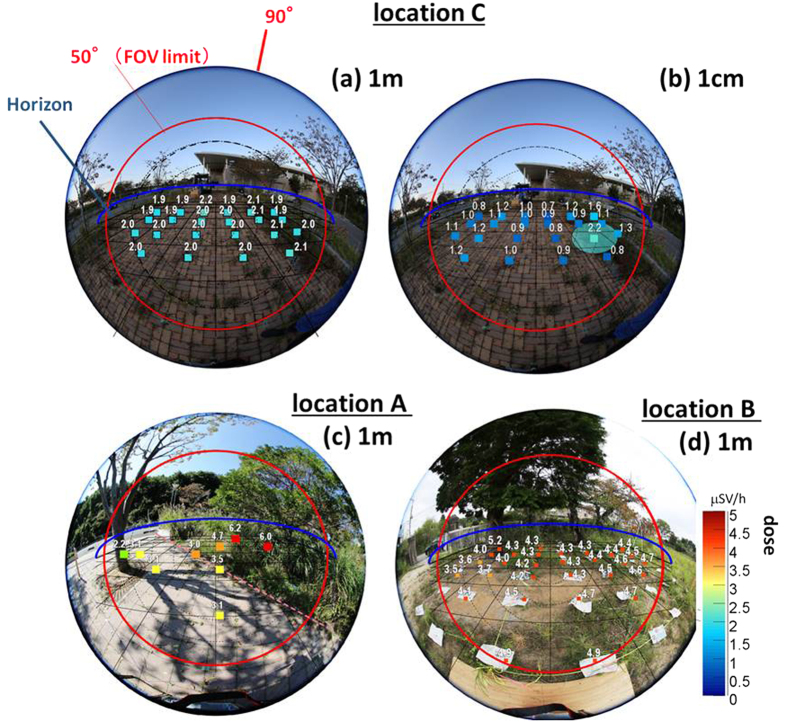
Figure 2. Comparison between 1-m dose and 1-cm dose.
Mapping results of (a) 1-m dose and (b) 1-cm dose at a decontaminated parking lot overlaid on the stereo perspective photographs taken with a fish-eye-lens camera. Doses at the height of 1 m and 1 cm on every 1 m square grid in the FoV of the ETCC were mapped as a reference with the commercial dosimeter (HORIBA, Radi PA-1100). See Fig. 1b for the setting of the 1-cm dose measurement. Panels (c) and (d) are the mapping results of 1-m dose at the locations (A) and (B), respectively.

