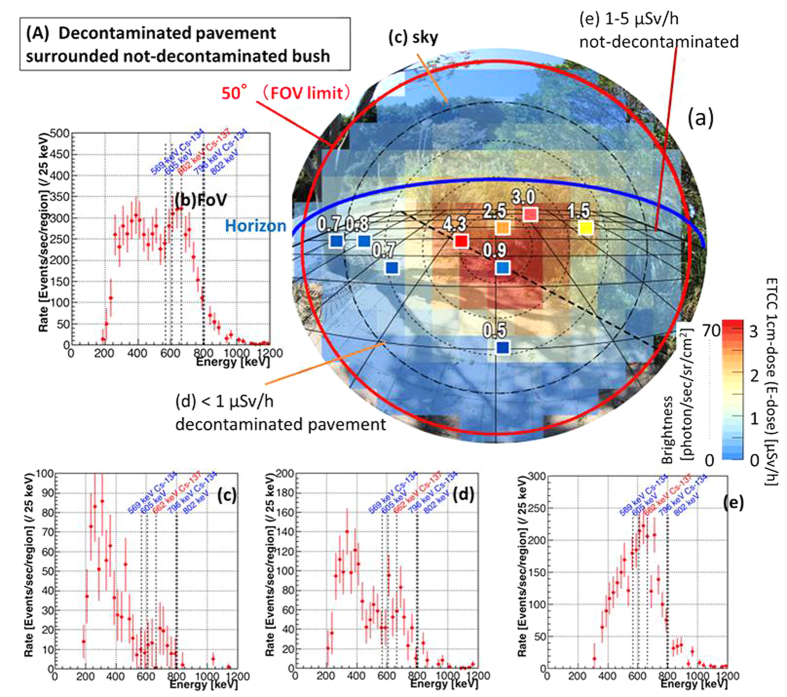
Figure 3. Energy Spectra at different points in one image of the ETCC (Imaging spectroscopic result).
Results in the location (A), decontaminated pavement surrounded with not-decontaminated bush. (a) Photograph (as in Fig. 2c) overlaid with nine coloured squares for the 1-cm dose and colour map for the E-dose estimated from the ETCC brightness for the energy band of 486–1000 keV. The exposure time is roughly 100 min. The red circle indicates the FoV (100° ϕ). The blue line is the horizon. This mapping is separated into three regions (c,d and e), from each of which the energy spectrum is accumulated. (b) Observed gamma energy-spectrum for the whole area within the FoV. (c) Sky region (i.e., above the horizon), (d) lowly contaminated region, and (e) highly contaminated region. The spectrum (e) indicates that Cs remains mainly on the surface of the ground and bush, producing the prominent peaks of 137Cs and 134Cs. In the spectrum (d), in spite of the decontamination work, Cs remains inside the gaps between tiles on the ground, and still emits line gammas, making up for a half of the brightness of this region, whereas the other half in the spectrum is the scattered gammas coming from Cs on or in the soil. The spectrum (c) shows the similar situation for the sky, where scattered lower-energy gammas appear more clearly than gammas at the Cs peaks.

