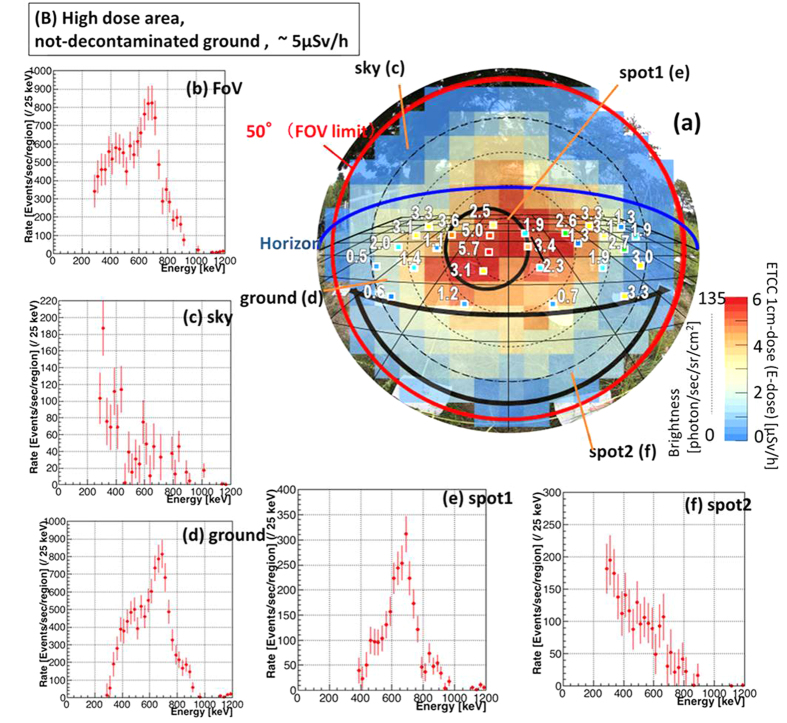
Figure 4. Imaging Spectroscopic results in contaminated area.
Results in the location (B): not-decontaminated ground. (a) Photograph (as in Fig. 2d) overlaid with the map of 1 cm dose (coloured squares) and the distribution of E-dose (colour image) as in Fig. 3a, and five energy spectra of (b) the whole FoV (c) the sky, (d) the ground and (e,f) two sub-parts of the ground, the regions for which are indicated in the panel (a). The exposure time by ETCC is 80 min. Two spots are chosen from the (not-decontaminated) ground region for higher (spot 1, Panel e) and lower (spot 2, Panel f) brightness regions. Their spectra show that the Cs peak is clearly more dominant in the high-dose spot than in the low-dose one.

