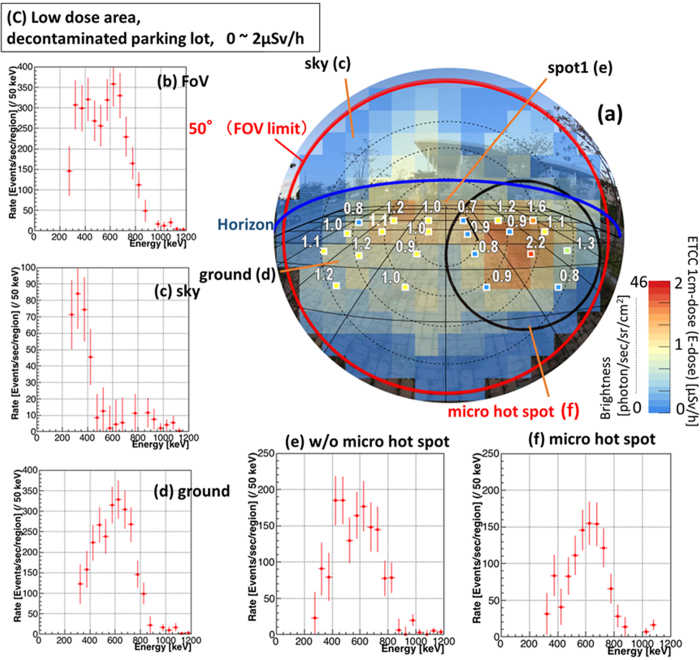
Figure 5. Imaging Spectroscopic results in decontaminated area.
Results in the location (C): decontaminated parking lot (Fig. 2a). The arrangement of the panels is the same as in Fig. 3, except panels (e) and (f), as explained below. The exposure time is 100 min. Both the peaks of Cs and low-energy scattered gammas are seen in (b), whereas a Cs peak in the ground and an associated scattered low-energy tail in the sky dominate the spectra (d) and (c), respectively. The ground is separated into two regions: (f) the micro hot-spot and (e) the rest. The spectra show the prominent Cs peak even in the low-dose micro spot (f), where the dose is only slightly higher than in the surrounding region.

