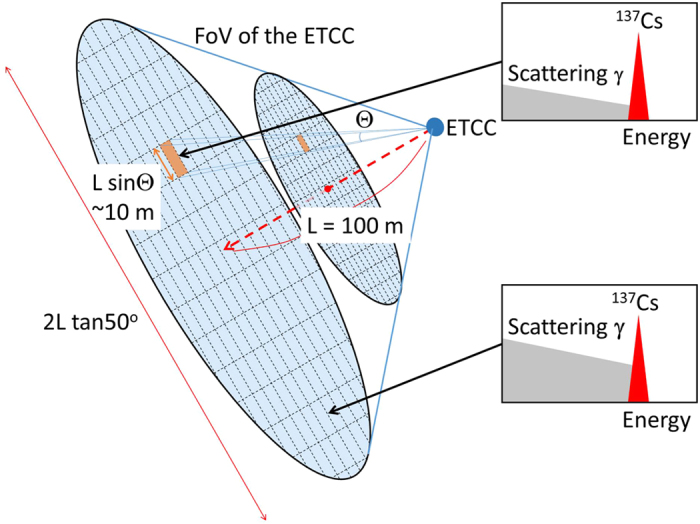
Figure 7. Schematic explanation of the detection limit of the ETCC from the point of view of geometrical optics.

Two ellipses filled in light blue show the planes perpendicular to the line of sight. Their areas correspond to the FoV of the ETCC at the respective distances, and are about 1 m × 1 m and 10 m × 10 m at distances of 10 m and 100 m, respectively, from the ETCC. We can perform gamma imaging-spectroscopy as highlighted schematically in the two insets.
