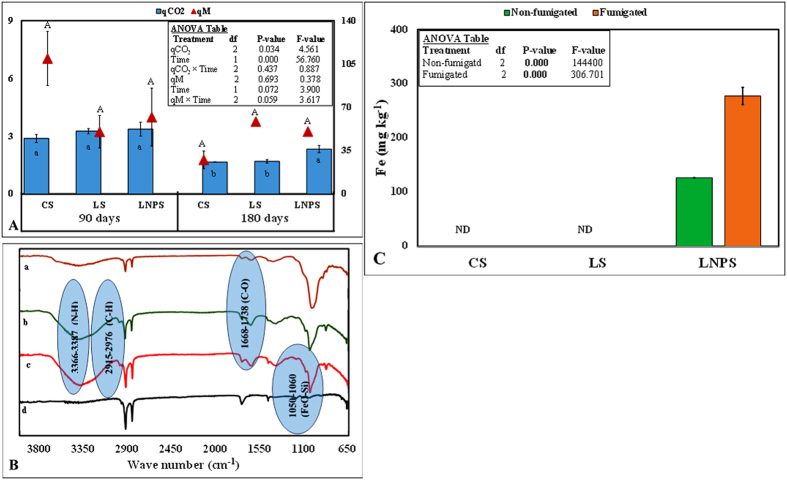
Figure 5.
Nanoparticles pollution indices (A) in control soil (CS) as well as soil amended with grass litter (LS), and grass litter-nanoparticles (LNPS) after 90 and 180 days of incubation. CO2-C emission per unit of microbial biomass carbon (mg C–CO2 g−1 Cmic) represented by metabolic quotient (qCO2) in the primary axis, and microbial quotient (qM) is expressed as microbial biomass carbon per total organic C (mg kg−1) in soil in secondary axis. Small letters in the panel indicate the differences among treatments and time for qCO2, and capital letters over error bars show the significant different for qM at 5% probability level. Fourier transform infrared spectra (B) in CS (a; dark red) LS (b; green), LNPS after 180 days of incubation (c; red) and iron oxide nanoparticles only (d; black). Microbial biomass Fe in fumigated and non-fumigated soil of CS, LS and LNPS treatment (C).

