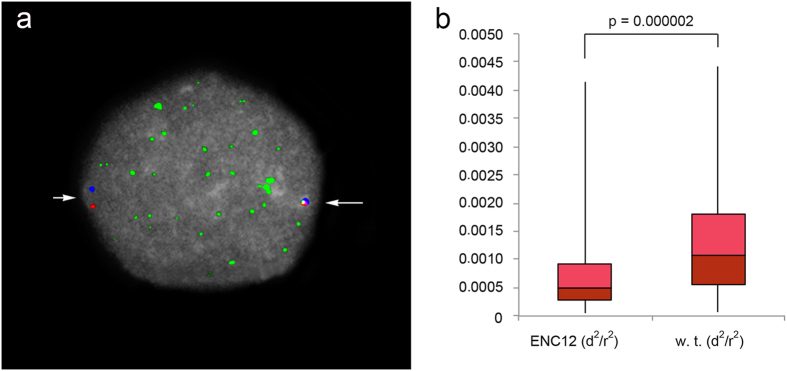
Figure 4. ENC chromatin compaction.
(a) Example of an immuno-FISH experiment on an interphase nucleus of the heterozygous PPY-10 individual. The compaction was measured using the BACs CH276-136P13 (red signal) and CH276-12M5 (blue signal), flanking the ENC12. Their precise position on the ponAbe2 assembly is reported in the Fig. 2. The green immuno signal of CENP-C was used to discriminate the ENC12 domain (long arrow) from the WT counterpart (short arrow). (b) The boxplot shows the distributions of interprobe normalized distances for the ENC12 and its WT counterpart. P-value was calculated by Mann-Whitney U-tests.

