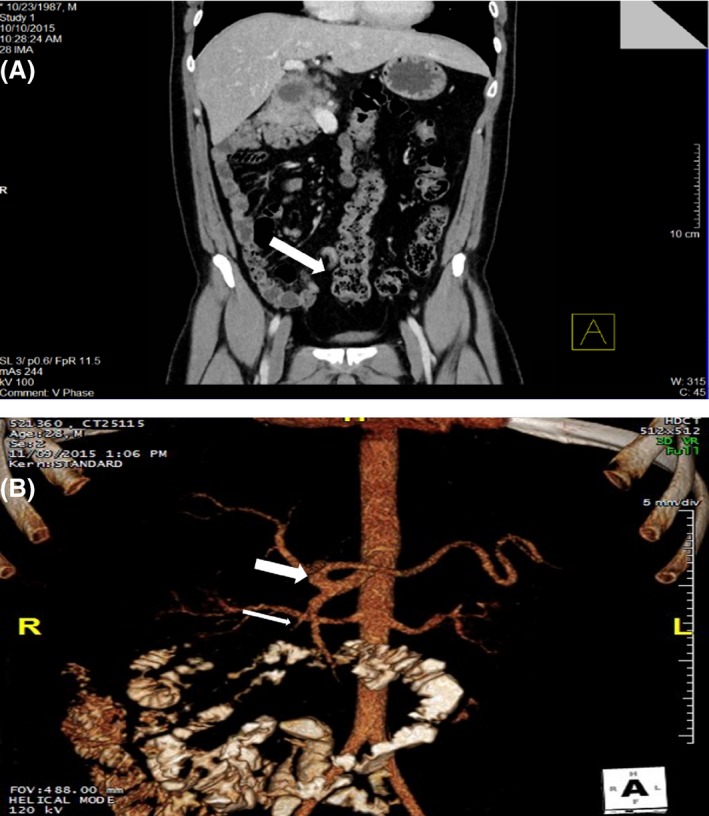
Figure 3.

(A) Coronal cut from the abdomino‐pelvic CT scan, showing bowels malrotation and an inferiorly located hepatic flexure (white arrow). (B) 3D reconstruction of the scan performed with IV contrast showing the vascular variation where the SMA branches from the celiac trunk (thick white arrow), giving off the gastroduodenal artery (thin white arrow).
