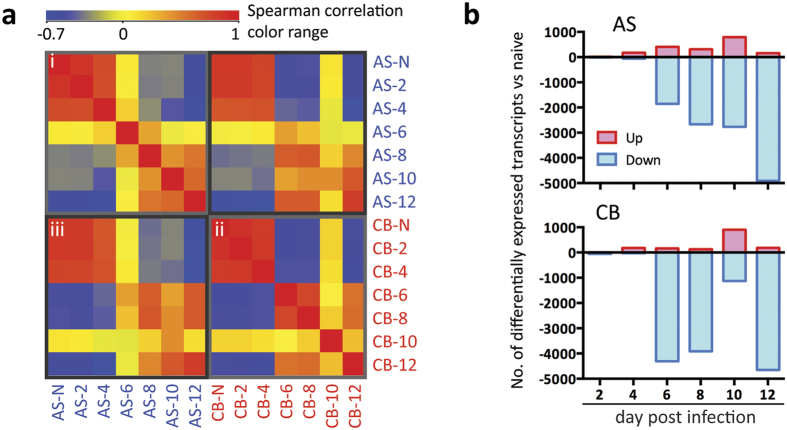
Figure 2. Whole blood transcriptomic analyses reveal distinct host responses in P. c. chabaudi avirulent AS and virulent CB infections.
(a) Heatmap of the Spearman rank correlation matrix. The transcripts were normalised across the median of all samples. Colours represent Spearman rank correlation coefficient between each condition with red representing positive rank correlation level above zero (yellow) for a given condition pair, and blue representing negative rank correlation level. (i) correlation amongst AS infected samples; (ii) correlation amongst CB infection samples; (iii) correlation between samples from AS and CB infections. (b) Bar charts showing the number of transcripts that were differentially expressed compared to naïve controls in AS and CB infections at different time points. Differential expression analysis (ANOVA unequal variance with post-hoc HSD test, FDR < 0.01) was performed on transcripts normalised to the median of their respective naïve controls.

