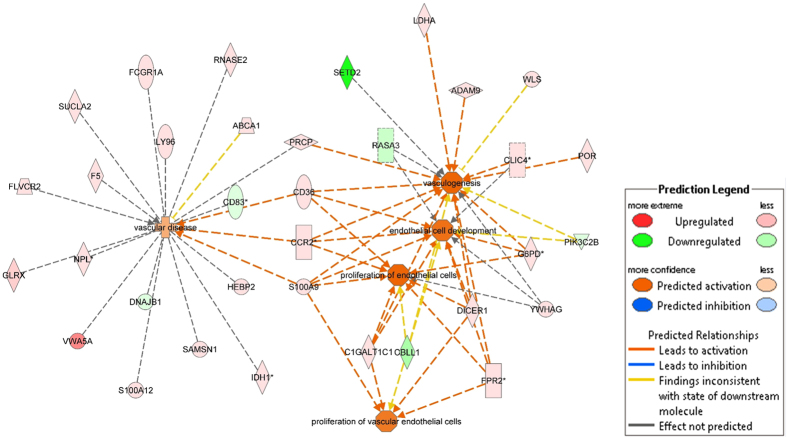
Figure 2. Interaction network of predicted activated or inhibited cardiovascular functions from expression level changes of the 200 genes best associated with late MO.
“Upregulated” refers to increasing gene expression levels when late MO increased and, vice versa, “Downregulated” refers to decreasing gene expression levels when late MO increased. Stars indicate genes with more than one expression probe - here, gene expression level changes correspond to the strongest associated expression probe. Full names of genes involved in the network are listed in Table S3.

