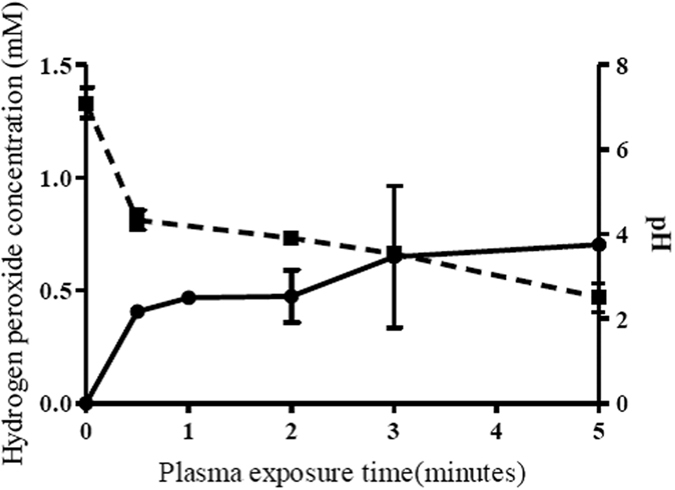
Figure 5.

Effect of plasma exposure on 100 μl of water on pH ( ) and the production of hydrogen peroxide (
 ). Each point represents the mean of three replicates with standard error.

Effect of plasma exposure on 100 μl of water on pH ( ) and the production of hydrogen peroxide (
 ). Each point represents the mean of three replicates with standard error.