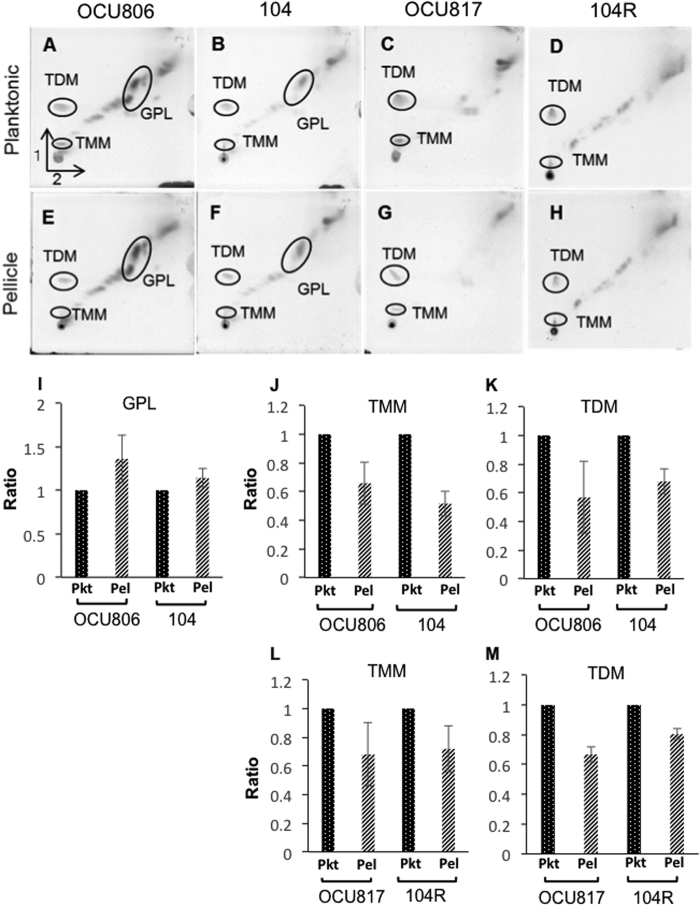
Figure 4. Profile of MAH glycolipids during planktonic and pellicle phases.
Mycobacterial lipids were extracted from 3-week culture of planktonic bacteria (A‒D) and pellicle bacteria. (E‒H) of MAH OCU806 (A,E), MAH 104 (B,F), MAH OCU817 (C,G) and MAH 104 R (D,H), and each sample was applied on 2D-TLC. GPLs (I), TDM (J,L) and TMM (K,M) were quantified using image analyser. Data of pellicle bacteria were represented as the ratio of the density to the respective sample of planktonic bacteria. Data were expressed as means ± S.D from three independent experiments. Pkt = planktonic bacteria, Pel = Pellicle bacteria. See also Supplementary Fig. S6 for the mass spectrometry data to confirm the assignments of glycolipids.

