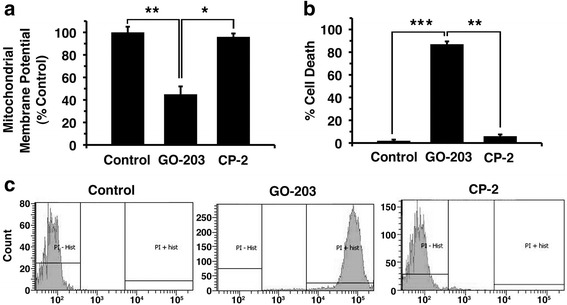
Fig. 4.

a SKCO-1 cells were treated with GO-203 and CP-2 for three days then mitochondrial membrane potential (JC-1) was measured. The results are expressed as the percentage (mean ± SD of 3 determinations) compared with that obtained for the control. b-c SKCO-1 cells were incubated with propidium iodide and analyzed by flow cytometry. The results are expressed as the percentage of cells with apoptosis. * p < 0.01, ** p < 0.01, *** p < 0.001
