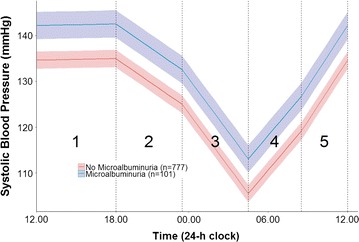
Fig. 3.

Predicted average (95% CI) piecewise linear trajectory of those with/without presence of microalbuminuria adjusted for age, sex and BMI using a linear mixed-effects model (Model 2). Each linear spline represents the rate of BP increase or decrease (slope) for that segment and has been given a corresponding number which is referred to in Table 2. For the purposes of this plot we have set the sleep and wake time knots at 23.00 and 08.00 respectively
