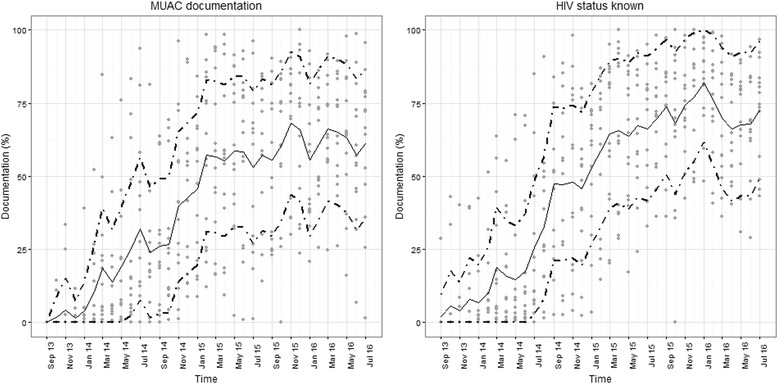
Fig. 1.

Scatter plots showing each hospitals’ performance (grey circular markers) each month from September 2013 to July 2016 for documentation of HIV status (panel a) and documentation of the result of screening using mid-upper-arm circumference (MUAC, panel b). The solid central trend line represents the median value of the 14 hospital specific observations and the upper and lower dotted trend lines represent the upper and lower interquartile range of the 14 hospital specific observations, respectively
