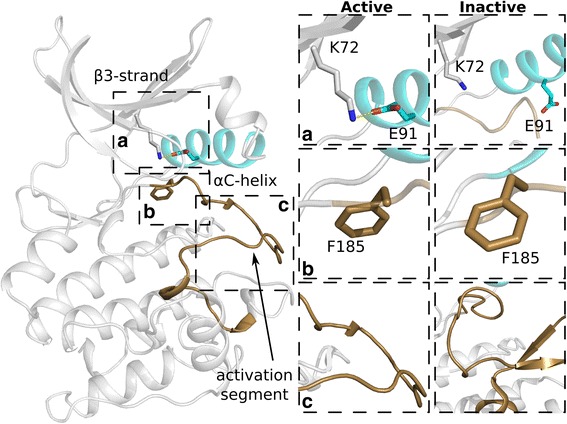
Fig. 1.

Kinase activation. a Formation of the K-E salt bridge (left). The salt bridge is not formed in the inactive conformation (right). b DFG-in (left) and DFG-out (right) conformations. c The inactive activation segment (right) can occlude the substrate binding region. The αC-helix is colored teal and the activation segment is colored brown
