Fig. 4.

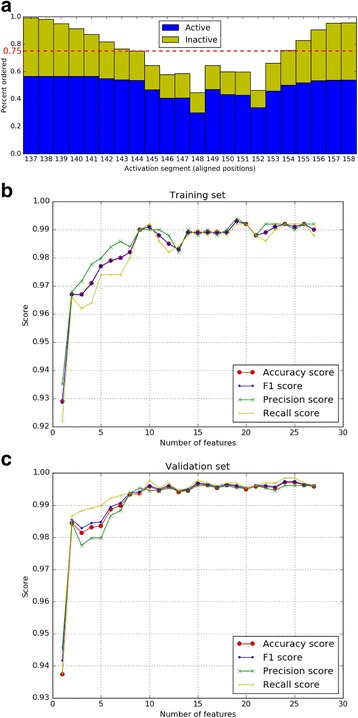
Disorder and accuracy. a Chart showing the percentage of structures with activation segment disorder. b Accuracy with increasing number of features on training set. c Accuracy with increasing number of features on validation set

Disorder and accuracy. a Chart showing the percentage of structures with activation segment disorder. b Accuracy with increasing number of features on training set. c Accuracy with increasing number of features on validation set