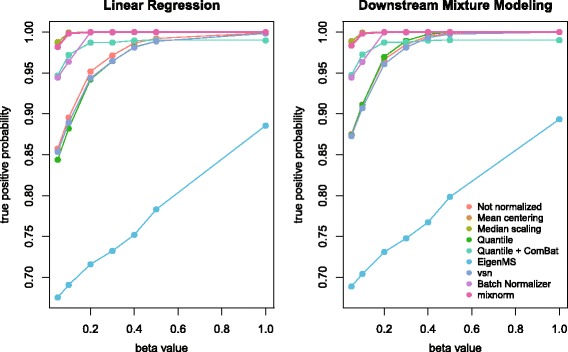
Fig. 4.

Plots of true positive probabilities (y-axis) under both linear regression and downstream mixture model analyses for detecting true associations in simulated data prior to and following normalization. Values on the x-axis represent the magnitude of association with the simulated phenotype according the simulated beta values. True positive probabilities are plotted for beta values with absolute value greater than or equal to 0.05, 0.1, 0.2, 0.3, 0.4, 0.5 and 1.0
