Fig. 9.

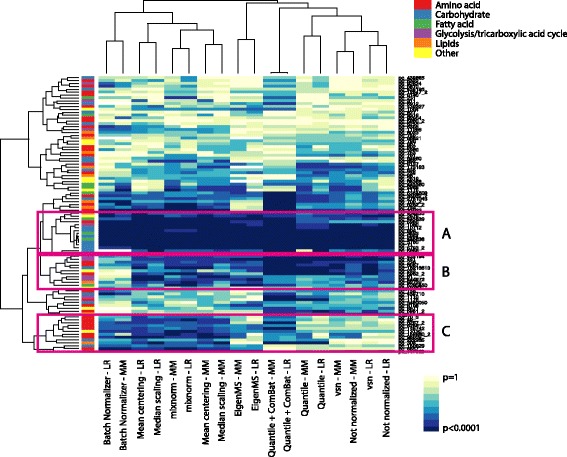
Heatmap of associations with maternal fasting plasma glucose (FPG) for fasting maternal metabolites in HAPO Metabolomics. The colors on the heatmap correspond to the strength of association with dark blue representing p-values close to 0 and light yellow representing p-values close to 1. Associations were detected using both linear regression and downstream mixture modeling prior to and following normalization with each approach. Hierarchical clustering was applied to columns and rows. Columns are close to each other for methods that detect similar associations. Rows are close each other if the strength of detected associations for the metabolites (represented by PubChem ID starting with ‘pc_’) are similar across the range of methods. Compound classes for each metabolite are represented by the lefthand vertical bar (red – amino acids; blue – carbohydrates; green – fatty acids; purple – glycolysis/tricarboxylic acid cycle; orange – lipids; yellow – other). Pink boxes A, B and C highlight clusters of metabolites detected by different sets of normalization approaches
